Table of Contents:
A Software Development Kit (SDK) is provided for RADIATE dataset. It was developed and tested with Python 3.7, and it should work with Python > 3.7. The SDK can be useful for sensor calibration, data visualisation and pre-processing. The following example and information can be simply retrieved by using the SDK.
Installation
$ git clone https://github.com/marcelsheeny/radiate_sdk.git
$ cd radiate_sdk
$ pip install -r requirements.txt
Run demo.py to visualise the dataset.
Dependencies
Python dependences needed by the SDK:
- matplotlib
- opencv-python
- pandas
- numpy
- pyyaml
How to use
The file ‘config/config.yaml’ controls which sensors to use and configures the parameters.
- camera_(left\right)_raw: This is the raw (left\textbackslash right) image captured from the ZED camera with the resolution 672 x 376. For this key, we do not provide the annotation, since the calibration is based on the rectified version. We provide it to the user in case they want to apply their own rectification/calibration method.
- camera_(left\right)_rect: This is the rectified (left\textbackslash right) image from the calibration parameters. Since we calibrated the other sensors related to the rectified version, we provide an approximated 2D annotation. We used the distance to the ground and average height of the object to estimate the 2D bounding box. We suppose the measurement is always done in flat roads. It is hard to guarantee that the bounding box projection always occurs accurately due to differences on sensing modality. Since the resolution of radar is low (17 cm), the annotation in the camera may not be very precise.
- radar_polar: It accesses the radar image in its raw polar format with resolution 400 x 576 (azimuth x range). The index 0 from the azimuth axis represents the angle ‘0o’ and 399 represents the angle ‘360o’. Regarding the range axis, index 0 represents 0 meters and index 575 represents 100 meters. This raw format is provided by the sensor manufacturer after applying Fast Fourier Transform (FFT). The manufacturer converts the raw information to decibel (dB), then it is quantised to values between 0 to 255. Therefore, we do not have the raw information in Decibel or Watts. The pixel value represents the power received by the sensor. This value comes mainly from the object material and the shape.
- radar_cartesian: It gives the radar image in cartesian coordinates. We provided a method in the SDK that converts the polar image to a cartesian image by projecting each point onto a (x,y) plane. After projecting each point we use bilinear interpolation to fill the holes without values. This gives an image with 1152 x 1152 image resolution.
- radar_cartesian_pc: This item gives the radar cartesian cfar in point cloud format as an ‘np.array’ with a shape (N,3), where N is the number of points and the columns are (x,y,i), where x and y are the values in meters, and i is the intensity power received by the sensor.
- lidar_pc: It gives the raw point cloud lidar information in the format (x,y,z,i,r) where x,y,z are the coordinates in meters relative to the radar sensor, ‘i’ is the power intensity received by the sensor. ‘i’ is quantised to values between 0 and 255, where it represents mostly the object material. And ‘r’ says from which ring of the sensor the point came from.
- lidar_bev_image: It gives an image with the same size as radar_cartesian with a bird’s eye view representation. This type of image is created for researchers who want to use the lidar in a grid format and also use it together with the radar in a grid format.
- proj_lidar_(left\right): This gives the projected lidar points in a camera coordinate frame. It can be used to improve the stereo reconstruction and also fuse the information from the camera with lidar.
The file demo.py contains a small code which just display the annotations.
import radiate
import numpy as np
import os

# path to the sequence
root_path = 'data/radiate/'
sequence_name = 'tiny_foggy'

# time (s) to retrieve next frame
dt = 0.25

# load sequence
seq = radiate.Sequence(os.path.join(root_path, sequence_name))

# play sequence
for t in np.arange(seq.init_timestamp, seq.end_timestamp, dt):
    output = seq.get_from_timestamp(t)
    seq.vis_all(output, 0)
In order to get the annotation values, the variable output is a dictionary with the sensor and its correspondent annotation.
Example:
output['sensors']['radar_cartesian'] contains a np.array with the radar image.
output['annotations']['radar_cartesian'] contains a list of bounding boxes with id, class_name and bbox. bbox : position is represented as x,y,width,height and bbox : rotation is the angle counter-clockwise in degrees. This is exemplified below:
'id': 1
'class_name': 'bus'
'bbox':{'position': [603.5340471042896, 149.7590074419735, 26.620884098218767, 73.56976270380676], 'rotation': 177.69489304897752}
SDK Documentation
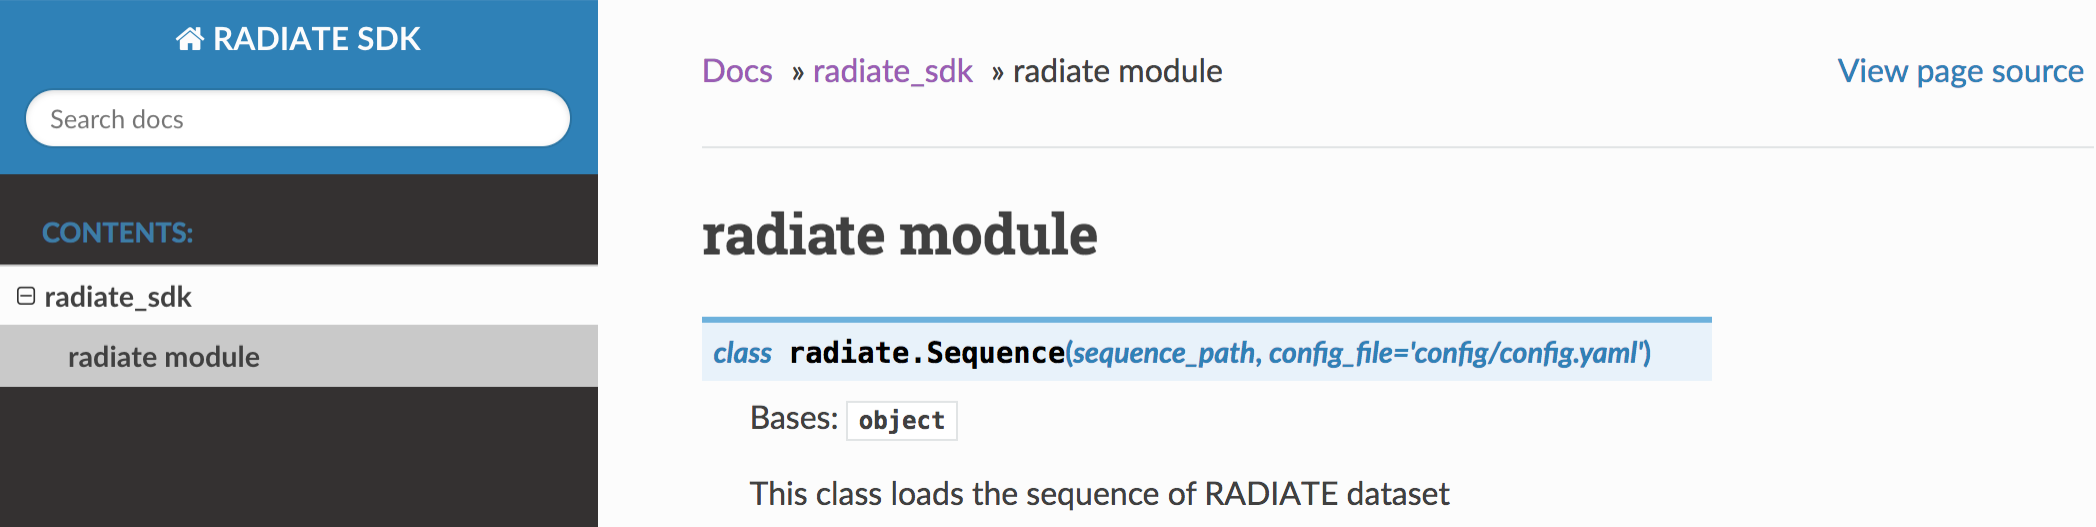
RADIATE class definition and its methods can be refereed at this online SDK documentation: https://marcelsheeny.github.io/radiate_sdk/radiate.html
Baseline Vehicle Detection from Radar
As a first baseline, we have performed evaluation of vehicle detection from single images. We defined a vehicle as one of the following classes: car, van, truck, bus, motorbike and bicycle.
We adopted the popular Faster R-CNN architecture to demonstrate the use of RADIATE for radar based object detection. Two modifications were made to the original architecture to better suit radar detection:
- Pre-defined sizes were used for anchor generation because vehicle volumes are typically well-known and radar images provide metric scales, different from camera images.
- We modified the Region Proposal Network (RPN) from Faster R-CNN to output the bounding box and a rotation angle which the bounding boxes are represented by x, y, width, height, angle.
To investigate the impact of weather conditions, the models were trained with the 2 different training datasets: data from only good and data from both good and bad weather. ResNet-50 and ResNet-101 were chosen as backbone models. The trained models were tested on a test set collected from all weather conditions and driving scenarios. The metric used for evaluation was Average Precision with Intersection over Union (IoU) equal to 0.5, which is the same as the PASCAL VOC and DOTA evaluation metric.
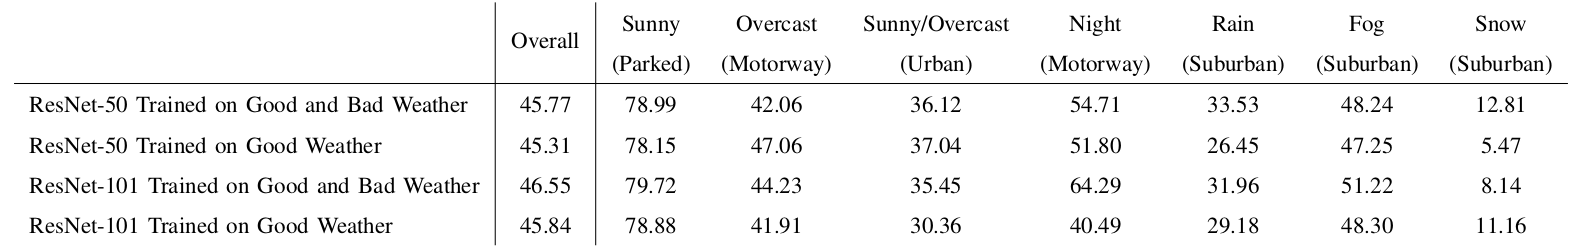
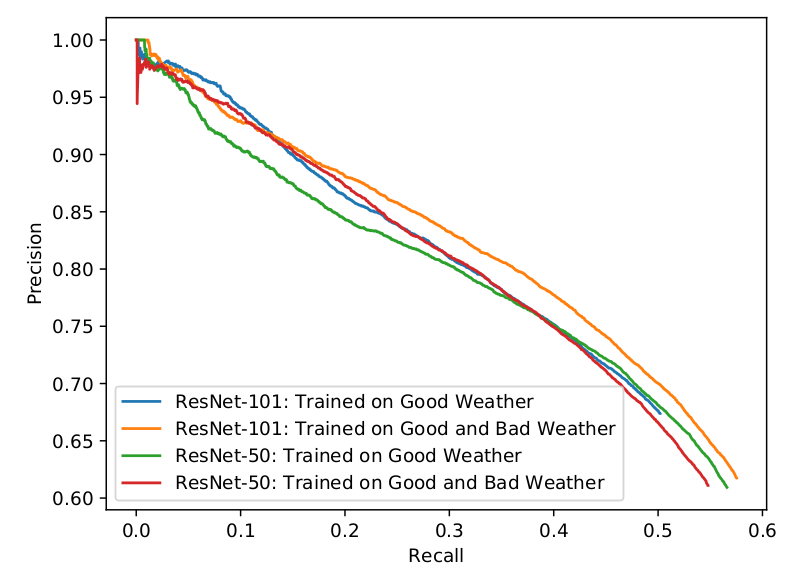
Baseline Detection Results
The results for each scenario and the precision-recall curve for each trained models are given in the below table and figure, respectively.
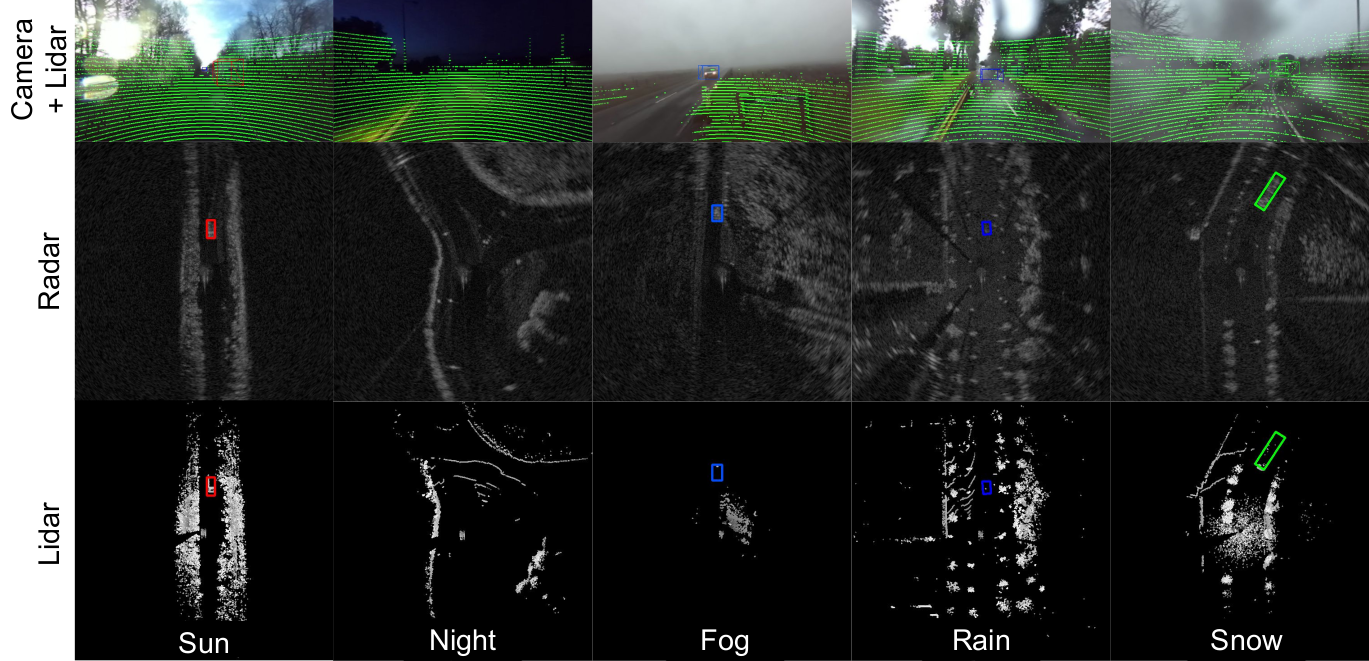
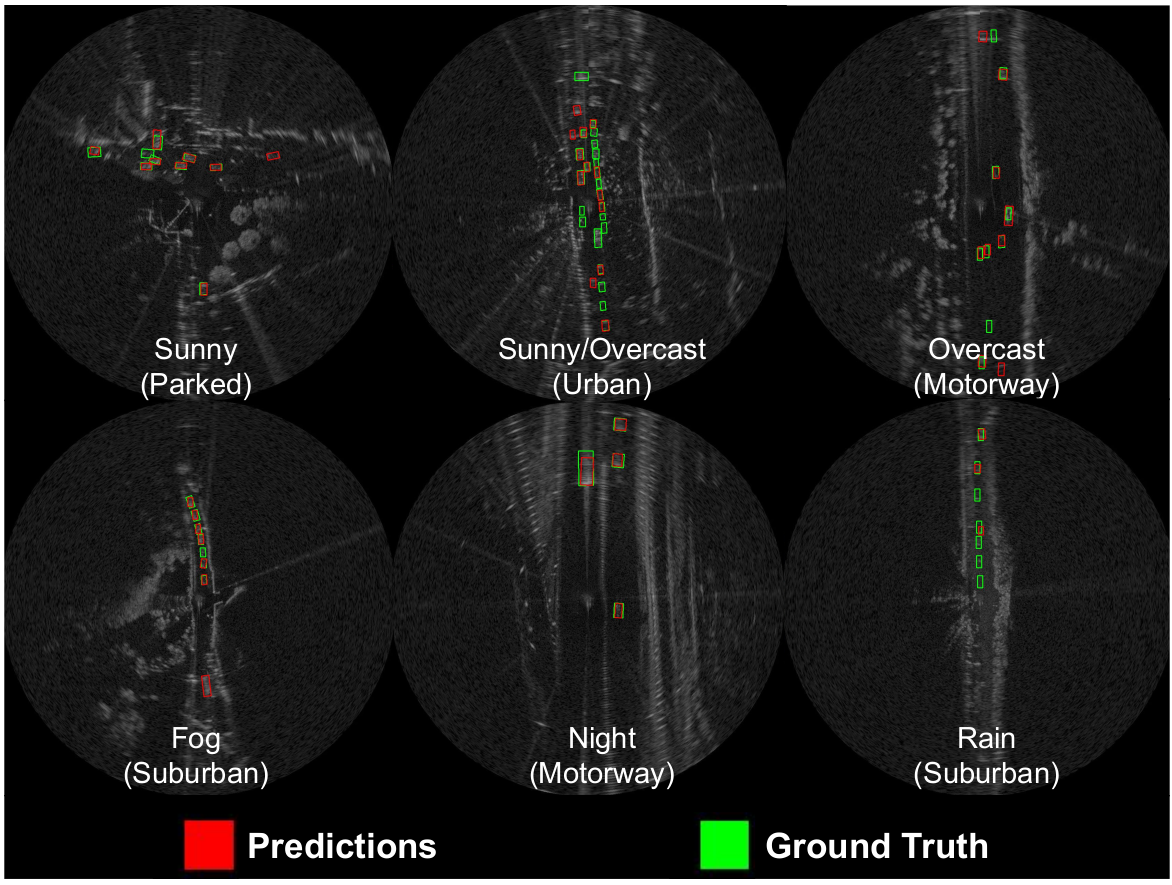
The figure bellow illustrates some qualitative results of radar based vehicle detection in various driving scenarios and weather conditions, using Faster R-CNN ResNet-101 trained in good weather only.
Baseline Pre-Trained Models and Codes
The code and the trained weights from radar based vehicle detection can be seen at https://github.com/marcelsheeny/radiate_sdk/tree/master/vehicle_detection